
NBA Schedule Analysis for Betting: Travel and Fatigue Metrics
 Available in US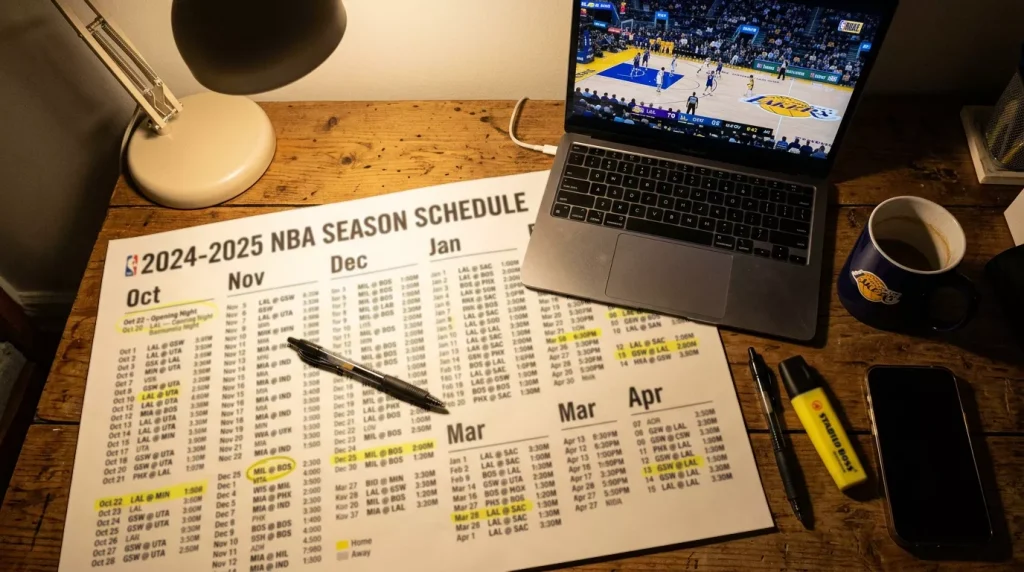
NBA Travel Fatigue: Betting Against Long Road Trips
I keep a simple rule pinned above my desk: never bet on a team in its fifth consecutive road game. I broke that rule twice in 2022. Both bets lost. The rule went back up and has stayed there since.
Road trips in the NBA are not created equal. A two-game road trip to nearby cities is a routine part of the schedule. A five-game road trip spanning three time zones is a grind that accumulates fatigue in ways that two-game trips do not. The performance decline is not linear — it accelerates as the trip progresses. Teams on games one and two of a road trip perform close to their season baseline. By game three, the decline becomes measurable: roughly 1-2 points below their normal away performance. By games four and five, the deficit can reach 3-4 points, driven by cumulative travel fatigue, disrupted sleep patterns, and the psychological wear of being away from home for over a week.
The performance dip of 1-3 points on the second game of a back-to-back is well-documented and widely priced by bookmakers. What is less well-priced is the cumulative fatigue of a long road trip even when the team has had a day off between games. A team that played in Portland on Monday, travels to Sacramento for a Wednesday game, and then continues to Phoenix for a Friday game has had rest days between each contest — but they have been in hotels, on planes, and away from their training facilities for five consecutive days. That non-back-to-back fatigue does not show up in simple rest-day calculations but absolutely shows up in on-court performance.
NBA teams averaged 14.9 back-to-back games in the 2024-25 season, down 23% over the decade. The league has worked to reduce extreme scheduling burdens, but road trips of four or five games still occur regularly. The schedule-makers balance competitive fairness with television and arena logistics, and those logistics sometimes produce brutal stretches for specific teams. Identifying those stretches before the bookmaker fully adjusts for them is a repeatable edge.
Games-in-N-Days: Measuring Schedule Density Beyond Back-to-Backs
Back-to-back tracking is the entry level of schedule analysis. It captures the most obvious fatigue scenario but misses the subtler ones. Games-in-N-days is the metric that captures what back-to-back tracking does not.
The concept is simple: count how many games a team has played in a rolling window of seven, ten, or fourteen days. A team that plays four games in seven days has a schedule density of 0.57 games per day. A team that plays five games in seven days (which happens when back-to-backs cluster with short turnarounds) has a density of 0.71. That difference — one extra game in the same window — produces measurable performance decline even when no single instance qualifies as a back-to-back.
I use a seven-day rolling window for most of my analysis. When a team’s seven-day density exceeds 0.60, I flag them as potentially fatigued and adjust my projections downward by 1-1.5 points. When the density exceeds 0.70, the adjustment increases to 2-3 points. These thresholds are not arbitrary — they are calibrated against three seasons of tracking density against spread performance, and the relationship is consistent enough to inform real-money decisions.
The bookmaker’s model almost certainly accounts for back-to-backs but may not fully account for schedule density. A team that played yesterday (back-to-back, easily identified) is different from a team that has played four games in five days but had last night off (dense schedule, less obvious). Both are fatigued, but only the first is flagged by the simple back-to-back check. The second falls through the cracks of a less sophisticated schedule analysis, and that is where the edge lives.
Free Schedule Analysis Tools for UK NBA Bettors
You do not need a paid subscription to track NBA schedule density. The data is publicly available, and the tools to process it are free.
The NBA’s official schedule page is the primary source. It shows every team’s full-season calendar with dates, opponents, and locations. From there, you can manually count games in any rolling window. For a full season of analysis, manual counting is tedious but feasible if you focus on the specific games you intend to bet rather than mapping every team’s entire schedule.
Basketball Reference offers team-level game logs that list every game played with dates, locations, and rest days. Sorting a team’s log by date and scanning for clusters of four or more games in seven days takes about two minutes per team. I do this once a week rather than daily, scanning the upcoming schedule for both teams in every game I am considering.
Several free NBA analytics sites offer pre-built schedule fatigue tools that display density metrics, rest days, and travel distances in a visual format. These tools colour-code games by fatigue level, making it easy to spot the worst scheduling stretches at a glance. I use these as a quick screening layer — if a game pops up as high-fatigue, I investigate further with detailed schedule and rest data.
For UK bettors, the research workflow fits naturally into a morning routine. NBA schedules are published well in advance, and the previous night’s results determine which teams are on back-to-backs or in the middle of dense scheduling stretches. By the time UK bookmakers post their lines around midday, you have already identified the games where schedule fatigue creates a mismatch — and you can compare the posted spread to your fatigue-adjusted projection to determine whether the bookmaker has priced the advantage correctly.
Schedule analysis is the lowest-tech edge in NBA betting. It requires no statistical models, no programming skills, and no paid data. It requires a calendar, the ability to count, and the patience to track patterns that the bookmaker occasionally undervalues. For a detailed look at the specific back-to-back dynamics that sit at the core of schedule-based betting, my guide on NBA rest-day advantage covers the rest differential angle in depth.
Articles




Created by the "CourtEdge" editorial team.
