
Best NBA Betting Systems: Data-Driven Strategies for UK Punters
 Available in US
Three seasons ago, I lost 14 consecutive NBA bets in a single week. Not because the picks were terrible — most of them lost by a single basket or a meaningless late free throw. I lost because I had no system. I was chasing lines, overreacting to Monday night's blowout, and sizing my stakes based on nothing more than how confident I felt after watching a half-hour of highlights. The week after that streak, I sat down with a spreadsheet, two academic papers, and ten years of back-to-back scheduling data. I haven't had a losing month that bad since.
That experience is the reason this guide exists. The global sports betting market is now valued at $125.12 billion and projected to reach $325.71 billion by 2035, growing at a compound annual rate of 11.24%. The NBA sits at the centre of that explosion — the league itself pulled in $11.3 billion in total revenue in 2024, and its partnership deals with betting operators exceeded $160 million in a single season. Money is pouring in. The question is whether you're going to capture some of it systematically, or keep donating it one gut-feel wager at a time.
System vs. strategy — a distinction worth making upfront. A betting system is a repeatable, rules-based process: specific triggers, defined stake sizes, measurable criteria for entry and exit. A strategy is broader — it's the overall approach, the philosophy. Every system lives inside a strategy, but not every strategy produces a system. This guide focuses on systems: concrete, testable, data-backed methods you can run against historical NBA data and track in a spreadsheet. If a method can't be backtested, it's an opinion, not a system.
When Adam Silver wrote in The New York Times that "sports betting should be brought out of the underground and into the sunlight where it can be appropriately monitored and regulated," he was making a case for transparency. That same transparency is what separates a systems-based bettor from someone flipping coins with their bankroll. The NBA generates more publicly available data than almost any other professional sport — pace, efficiency, lineup combinations, referee assignments, rest patterns. The information is there. The edge comes from organising it into something actionable.
I've spent 11 years doing exactly that, specialising in schedule-based handicapping, bankroll optimisation, and data-driven wagering for the UK market. This guide distils everything I've learned into a single resource — not a collection of vague tips, but a framework built on peer-reviewed research, real market data, and the kind of hard lessons that only come from tracking thousands of bets. Whether you're working with a modest bankroll on a UKGC-licensed platform or building your first prediction model, every system in here has been stress-tested against the numbers. Let's get into it.
Data-Driven NBA Betting: System Building for UK Punters
- NBA betting systems built on schedule data, pace metrics, and bankroll discipline consistently outperform gut-instinct wagering — the global sports betting market now exceeds $125 billion, and most of that money flows from casual bettors to systematic ones.
- Back-to-back fatigue is the most reliable schedule edge: road teams on the second night lose 18% more often than baseline, with below-.500 teams hit hardest.
- Fractional Kelly staking (1/5 Kelly) returned over 98% ROI in a single-season simulation, while full Kelly and Martingale both led to bankroll ruin.
- Three advanced stats — field goal percentage, defensive rebounds, and turnovers — predict NBA outcomes more reliably than any other combination, with three-point shooting gaining significance in second halves.
- UK bettors should use UKGC-licensed platforms exclusively, shop lines across at least three accounts, and run a structured pre-bet checklist before every wager.
The NBA Betting Market in 2026: Scale, Growth, and UK Access
I remember when placing an NBA bet from the UK meant scrolling through a thin menu of moneylines and maybe a spread if you were lucky. Walk into any licensed bookmaker's app today and you'll find player props, quarter totals, same-game parlays, and live markets that update every possession. The shift happened fast, and understanding the scale of the market you're operating in matters — because the bigger the market, the more data it generates, and the more opportunities a systematic bettor can find.
$166.94 billion
Amount Americans legally wagered on sports in 2025 — an 11% increase year-on-year. Bookmaker revenue hit a record $16.96 billion.
$78.72 billion
Total gross gaming revenue for the US commercial gaming industry in 2025, up 9.2% from the prior year.
39 states + DC
Number of US jurisdictions with legal sports betting by 2025, with 32 offering online and mobile options.
Those numbers paint the American picture, but the UK market has its own weight. The UK Gambling Commission reported total remote gambling revenue of £7.8 billion for the year ending March 2025 — a 13.1% increase. Online sports betting through apps accounts for roughly 8% of the entire UK adult population, with the split running 15% among men and 4% among women. That means millions of people in Britain are already betting on sport through their phones every month, and NBA coverage on UK platforms has expanded to match the demand.
UK punters place approximately 290 million online bets on real sporting events every single month. Even a fraction of that volume directed at NBA markets creates enough liquidity to support systematic betting approaches that wouldn't have been viable five years ago.
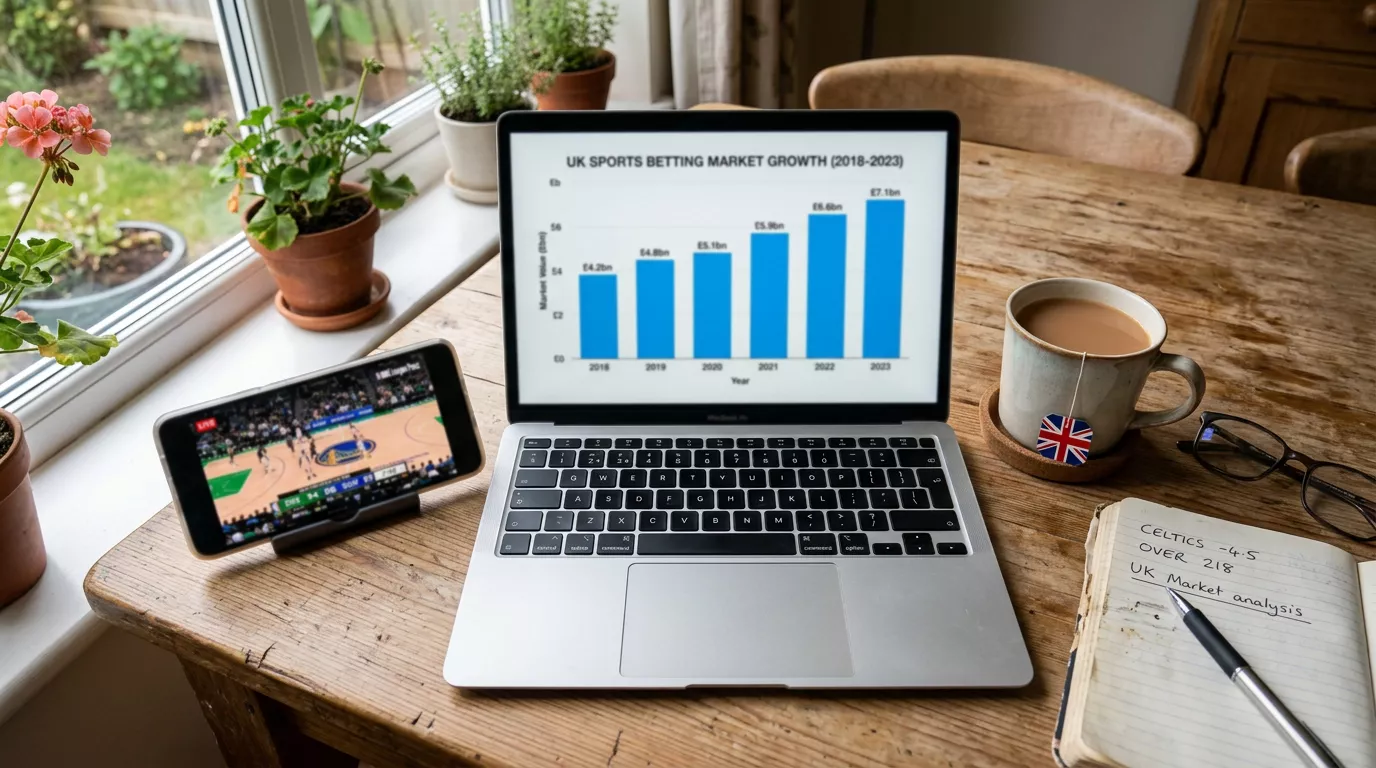
The UK's sports betting market generates £16.8 billion in annual gross gaming revenue, and online revenue from real sporting events reached £596 million in the quarter ending March 2025 alone — up 5% year-on-year. For NBA bettors, the practical implication is straightforward: the market is deep enough, and the bookmaker coverage broad enough, that you can shop lines, exploit pricing differences, and build a genuine system without hitting the walls that smaller markets impose.
One trend worth tracking: 48% of UK adults participated in some form of gambling in the most recent survey period. That's nearly half the country. The NBA's growing visibility in Britain — driven by London games, expanded broadcast deals, and the sheer entertainment value of the product — means the basketball betting market here is no longer a niche afterthought. It's a real market, with real inefficiencies, and real opportunities for anyone willing to approach it with discipline.
Bill Miller, president of the American Gaming Association, put it plainly when discussing record revenues: these numbers demonstrate the broad appeal of regulated markets and why strong oversight remains essential as the industry evolves. That's as true in the UK as it is in the States. Regulation creates structure, and structure is what a systems bettor builds on.
The market is enormous and still growing. The question now is how to exploit the specific inefficiencies that NBA betting offers — starting with the most popular market: the point spread.
Point Spread Systems: Exploiting ATS Inefficiencies
The first NBA bet I ever placed was a spread bet. I backed the Celtics at -6.5, they won by exactly six, and I learned the difference between winning a game and covering a spread in the most annoying way possible. That half-point education is the foundation of every ATS system — the margin matters as much as the outcome, and the bookmaker's job is to set a number that splits public opinion roughly down the middle. Your job is to find the spots where that number is wrong.
Reading an NBA spread in decimal odds
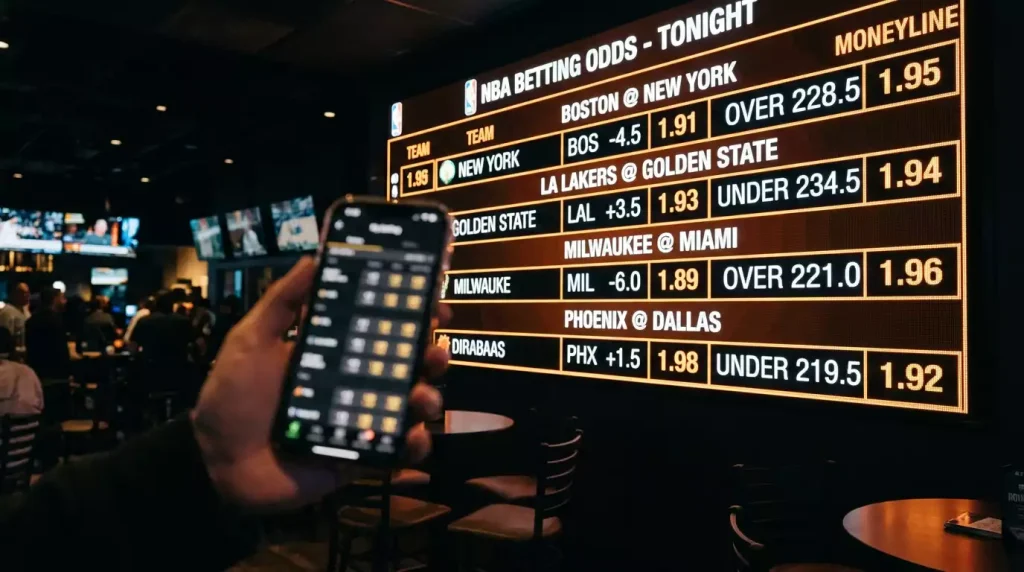
Suppose the spread is set at -5.5 for the home side, priced at 1.91 on both sides. The home team needs to win by 6 or more for the bet to land. The implied probability at 1.91 is roughly 52.4%, meaning the bookmaker believes neither side of the spread is significantly more likely. A systematic bettor's task is to identify situations where the true probability deviates from that 52.4%.
Home teams in the NBA win close to 60% of their games outright — one of the strongest home-court advantages in American professional sport. But winning outright and covering a spread are different propositions. The bookmaker already prices home advantage into the line, so the raw win percentage is baked in before you even look at the market. Where the edge lives is in the situations the line doesn't fully account for: fatigue, scheduling, injury timing, and the behavioural patterns of teams in specific contexts.
Consider the performance drop on the second night of a back-to-back. The fatigue penalty is real and measurable — and it's steeper for teams on the road. When the line is set on a Monday morning but the injury report shifts on Tuesday afternoon — or when the public hammers a popular team regardless of rest disadvantage — the spread can lag behind the true probability. That's where an ATS system earns its keep.
Applying a spread system to a schedule spot
Step 1: Identify a team playing the second night of a back-to-back, away from home. Historical data shows these teams lose roughly 18% more often than their baseline.
Step 2: Check the spread. If the line hasn't moved more than 1.5 points from the opener, the market may not have fully adjusted.
Step 3: Confirm via the injury report — if the team is also missing a rotation player, the spread is likely undervaluing the opponent.
Step 4: Place the bet on the opposing side at the current spread, sizing according to your standard unit.

I should be clear: no single spread system produces profit in isolation. The edge comes from stacking multiple filters — schedule spot plus home-court plus injury context — and betting only when three or more signals align. If you want the full breakdown of ATS splits, bounceback spots, and worked examples with decimal odds, I've written a dedicated piece on NBA spread betting strategy that goes much deeper than this overview can.
Spreads are the headline market, but totals offer a different kind of inefficiency — one rooted in pace, fatigue, and scoring dynamics that the public consistently misprices.
Over/Under Systems: Pace, Fatigue, and Scoring Models
Most bettors think of totals as a coin flip — will the game go over or under? That framing is exactly why the market is exploitable. Totals aren't random. They're a function of pace, efficiency, and fatigue, and each of those variables is measurable before tip-off. I've found more consistent edges in totals markets than in spreads over the past five seasons, and the reason is simple: the public bets totals based on recent scorelines, while the data tells a more nuanced story.
Pace factor — the estimated number of possessions a team uses per 48 minutes. Two fast-paced teams meeting will generate more possessions and, on average, more points than two grind-it-out defensive sides. Pace is the single strongest predictor of game totals, and it's publicly available on every major stats site.
Here's where it gets interesting for in-game dynamics. Research by Wang et al., analysing 2,295 NBA games over a decade, found that the median pace in fourth quarters of close games drops to 90-100 possessions — significantly lower than the first half. That pace collapse is a structural feature of the sport: teams slow down, foul rates rise, and the clock becomes a weapon. A totals system that ignores fourth-quarter dynamics is building on incomplete data.
García et al. documented a physical performance decline across the course of a game with an effect size of -1.27 between the first and fourth quarters. That's not a subtle finding — it's a massive drop-off. When you combine pace deceleration with physical fatigue, the implication for totals is clear: late-game scoring tends to compress, especially in competitive games. The under in tight fourth quarters is not a guess; it's a pattern backed by sports science.
Totals example in decimal odds
A game total is set at 224.5, with the over priced at 1.95 and the under at 1.87. The pricing tells you the bookmaker slightly favours the over. If your pace model projects 218-220 total points based on both teams' pace factors and defensive efficiency, the under offers value despite the tighter price.
Building a totals system means tracking three things: pace factor for both teams, their recent defensive efficiency ratings, and the schedule context — particularly whether either team is on the second night of a back-to-back, when shooting efficiency tends to drop. I run a simple pace-adjusted projection for every game on my slate, compare it to the posted total, and only bet when my number and the market diverge by 3 or more points. That threshold keeps me out of marginal spots and focused on the clearest value.
The seasonal arc matters too. Early-season totals are often set higher because bookmakers anticipate the looser defence and faster pace of October and November basketball. By February, rotations tighten, teams play more half-court offence, and totals drift lower. A system that adjusts for seasonal pace trends catches value that a static model misses.
Pace and fatigue are the engines of a totals system. But fatigue itself is driven by the NBA schedule — and the schedule is the most data-rich edge available to systematic bettors.
Schedule-Based Systems: Back-to-Backs, Rest Days, and Travel
If I could only use one data point for the rest of my betting career, I'd pick the schedule. Not the injury report, not the advanced stats, not even the odds themselves — the schedule. It's the only variable that's known weeks in advance, fully public, and consistently underweighted by the market. The NBA's 82-game regular season is a logistics nightmare for players and a goldmine for bettors who track it properly.
14.9 games
Average number of back-to-back sets per NBA team in the 2024-25 season — a 23% decline over the past decade as the league has worked to reduce schedule density.
1-3 points
Estimated performance drop on the second night of a back-to-back, with the effect most pronounced for away teams.
18% more losses
Teams playing the second game of a back-to-back on the road lose 18% more often than their baseline — a finding from numberFire's multi-season analysis.
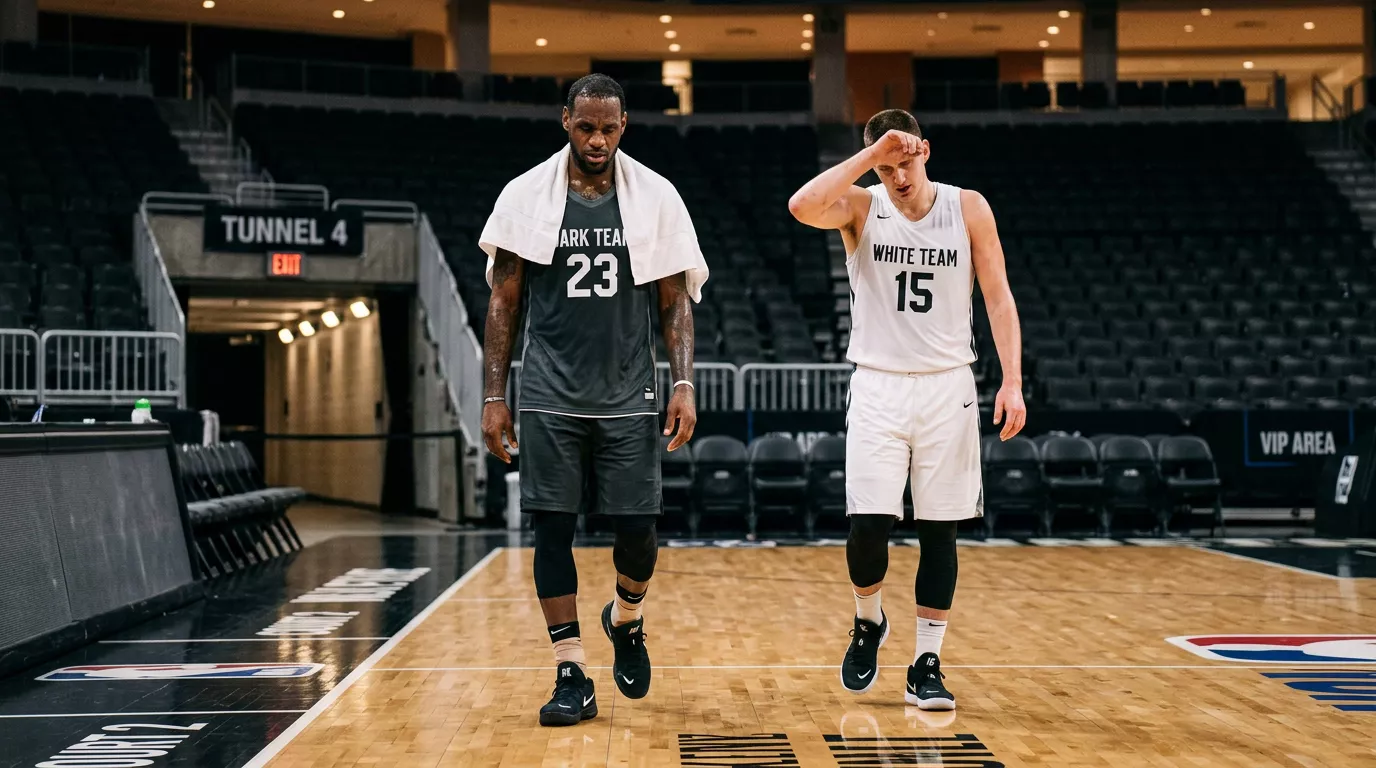
The back-to-back is the most studied schedule edge in NBA betting, and for good reason: the data is unambiguous. But the effect isn't uniform. Winning teams — those with records above .500 — lose roughly 5% more often than usual on the second night. Losing teams drop off by 11%. That gap is enormous. It means a system that fades all back-to-back teams equally is leaving value on the table. The sharper play is to focus on below-.500 teams in road back-to-backs, where the fatigue penalty stacks on top of an already negative baseline.
Rest-day advantage works the same principle in reverse. When a rested team meets a fatigued opponent, the differential creates a spread and totals edge that the market sometimes underprices — especially early in the week, before the betting public focuses on the matchup. I keep a rolling calendar that flags every rest mismatch, and it's one of the most reliable filters in my system.
Travel is the third leg of the schedule triangle. A five-game road trip through three time zones doesn't hit the same as a two-game swing within the same conference. Altitude changes — Denver being the obvious example — compound the fatigue effect. The NBA schedule is publicly available months in advance, which means you can build a season-long calendar of target spots before the first game tips off. That kind of preparation is what separates a system from a hunch.
The full methodology for building a back-to-back system — including the data splits by team record, home-vs-road breakdowns, and step-by-step construction — lives in my dedicated guide to the NBA back-to-back betting system. Here, I want to emphasise the principle: schedule data is free, predictive, and chronically underused by casual bettors. Build it into every pre-game analysis.
CourtEdge · Proprietary Tool
The Rest Residual
A schedule edge only pays if the market has not already taken it. Enter the rest situation and the line movement: the model prices the fatigue, subtracts what the market has already moved, and shows what is left unpriced.
| Model schedule price | +3.20 pts |
|---|---|
| Already moved by market | +1.00 pts |
| Unpriced residual | +2.20 pts |
| Value side | Opponent |
| Cover probability | 57.3% |
| Fair decimal price | 1.75 |
| Edge per £1 staked | +£0.094 |
| Stake, 1/5 Kelly | 2.07% |
| Stake amount | £20.69 |
Qualifies
The market has taken 1.00 of the 3.20 points this spot is worth. 2.20 points remain unpriced, so the value sits on the opponent.
How it prices rest: second night of a back-to-back is worth 1.6 points before context, one day off 0.35, two days zero, three or more a small freshness bonus. Venue, record and travel scale the fatigued side only. Total adjustment is capped at 4 points.
Points to probability: the residual is divided by 12, the approximate standard deviation of NBA spread error, so roughly one point equals 3.3 percentage points of cover probability.
A residual under 0.75 points is noise, not an edge. Never bet a schedule spot in isolation: confirm injuries, announced lineups and at least one other filter first. Stake sizing is capped at 3% of bankroll. 18+ only, and use the deposit limits your UKGC-licensed operator provides.
Value Betting: How to Find +EV Opportunities in NBA Lines
A friend once asked me, "How do you know when a bet is good?" I told him: a good bet is one I'd place a thousand times. Not because I'd win every time — I wouldn't — but because over a thousand iterations, the maths would put money in my pocket. That's value betting in a sentence. You're not predicting winners; you're finding prices that understate the true probability of an outcome.
Expected value (+EV) — the average profit or loss per unit staked if a bet were placed infinitely. A +EV bet is one where your assessed probability of winning exceeds the implied probability embedded in the odds. If you believe a team wins 55% of the time but the odds imply only 50%, every unit staked has positive expected value.
Calculating expected value on an NBA spread bet
Step 1: Assess the true probability. Your model estimates the home team covers the spread 56% of the time.
Step 2: Check the decimal odds. The bookmaker offers 1.93 on the home side.
Step 3: Calculate implied probability. 1 / 1.93 = 51.8%.
Step 4: Compare. Your 56% vs. the market's 51.8% gives you a 4.2 percentage point edge.
Step 5: Compute EV per unit. (0.56 x 0.93) - (0.44 x 1.00) = 0.5208 - 0.44 = +0.08. For every £1 staked, expected profit is 8p.
Eight pence per pound doesn't sound like retirement money, and it isn't — on a single bet. But compound it across 500 bets per season at 2% of bankroll per wager, and you're looking at meaningful growth. The discipline is in only betting when the EV is positive, which means passing on the majority of games. I typically find 3-5 qualifying bets per night on a full NBA slate, which means ignoring 8-10 games entirely. That restraint is the hardest part of value betting, and it's where most people fail.
Live markets are where some of the juiciest value appears. In-play betting now accounts for 62.35% of online betting revenue globally, and the speed at which NBA live odds adjust creates windows of opportunity. A momentum swing in the third quarter, a key player picking up a fourth foul, a timeout that resets the tactical picture — these moments cause live lines to shift, and the shift doesn't always land in the right place. Speed matters in live value betting, and UK platforms vary significantly in how quickly they update their NBA lines.
Line shopping is the mechanical foundation of value betting. If you're using a single bookmaker, you're leaving money on the table every week. Even a 0.05 difference in decimal odds adds up over hundreds of bets — it's the compound interest of sports betting. UK bettors have the advantage of access to multiple UKGC-licensed platforms, each with slightly different NBA pricing. A systematic line-shopping routine takes ten minutes per game and can add several percentage points to your annual return.
The concept is simple: bet only when the price exceeds your estimated probability. The execution demands a model, a spreadsheet, and the patience to sit on your hands when the numbers don't line up. If you want a more detailed treatment of the mechanics, my piece on NBA live betting strategy covers the in-play side, including platform latency and fourth-quarter tactics.
Bankroll Management and Staking Systems Compared
I've seen sharp bettors with genuine edges go broke, and I've seen mediocre handicappers grind out a profit over a full season. The difference is almost never the picks. It's the staking. Bankroll management is the least exciting topic in sports betting and the single most important one. Skip this section at your own financial peril.
Flat staking
Bet the same fixed amount — typically 1-3% of your total bankroll — on every qualifying wager. The advantage: simplicity, emotional detachment, and protection against long losing streaks. The drawback: it doesn't capitalise on high-confidence bets. Flat staking is the default recommendation for anyone who hasn't built a reliable probability model, and it's what I used for my first four years.
Progressive systems (Martingale, D'Alembert, Fibonacci)
Increase your stake after a loss (Martingale doubles it) to recover previous losses with the next win. The appeal is obvious — in theory, one win wipes the slate clean. In practice, a losing streak of 7-8 bets (which happens multiple times per NBA season) requires stakes so large they either exceed your bankroll or hit the bookmaker's maximum bet limit. Progressive systems are the leading cause of bankroll ruin among NBA bettors.

The data on this is unambiguous. A simulation study by Dotan found that a "1/5 Kelly" strategy — betting one-fifth of the amount the Kelly criterion recommends — produced an ROI above 98% over a single NBA season, while full Kelly led to complete bankroll depletion. Let that sink in: the mathematically optimal staking formula, applied at full strength, wiped the bankroll to zero. The fractional version, which bets far less per game, returned nearly double the starting amount. More aggressive does not mean more profitable. In staking, restraint is the edge.
Roughly 1-2% of the US adult population meets the clinical criteria for gambling disorder — between 2 and 4 million people. Another 5-9 million show subclinical symptoms. A staggering 52% of online bettors have chased losses at least once, and 37% have felt shame after a losing session. These are not abstract statistics. Bankroll management is the structural barrier between disciplined betting and the behavioural spiral that leads to financial harm. If you find yourself increasing stakes to recover losses, stop. That's not a system — it's a symptom.
My approach today uses a modified fractional Kelly. I estimate the probability of each bet based on my model's output, calculate the Kelly stake, and then divide by five. On a typical night, my bet sizes range from 0.5% to 2.5% of bankroll, with the size scaling to the estimated edge. Games where my model shows a small edge get small stakes; the rare games where it shows a large edge get larger ones. The key constraint is a hard cap at 3% — I never exceed it, regardless of how confident the model looks. Confidence is a feeling. The cap is a rule.
For UK bettors, the platform-level tools available on UKGC-licensed sites — deposit limits, cooling-off periods, reality checks — should be treated as part of your bankroll management infrastructure, not as optional features for problem gamblers. I set deposit limits on every account I use. It's not a sign of weakness; it's a structural guardrail that prevents impulsive behaviour on a bad night. The full methodology, including simulation comparisons and platform-specific tools, is covered in my NBA bankroll management guide.
Advanced Stats That Predict NBA Outcomes
When I first started building NBA models, I made the rookie mistake of drowning in data. I tracked 47 different statistics per team, per game. My spreadsheet looked like a surveillance operation. It took me two full seasons to learn that more data isn't better data — the right data is better data. An XGBoost study published through the National Institutes of Health confirmed what I'd learned the hard way: three indicators consistently predict NBA game outcomes across every segment of a match.
Field goal percentage
The most consistently significant predictor of game outcomes across all four quarters. Teams that shoot efficiently win more often — obvious in theory, powerful when quantified.
Defensive rebounds
Ending the opponent's possession is the single most impactful defensive statistic. Teams that control the defensive glass limit second-chance points and generate transition opportunities.
Turnovers
Every turnover is a lost possession — and in a game decided by pace and efficiency, possessions are currency. Turnover rate is a stable predictor that holds across game segments.
What changes as the game progresses is which secondary metrics gain significance. The same study found that in the second half, three-point shooting and offensive rebounds become more important. That makes intuitive sense: late-game basketball is more half-court, more deliberate, and more reliant on individual shot-making and hustle plays. For a bettor building a pre-game model, the implication is that your stat inputs should be weighted differently depending on whether you're projecting a full game, a half, or a quarter.
Offensive Rating (ORtg)
Points scored per 100 possessions. Normalises for pace, allowing direct comparison between fast and slow teams. The foundation of any efficiency-based model.
True Shooting % (TS%)
Accounts for the value of three-pointers and free throws, giving a more complete picture of shooting efficiency than raw field goal percentage. A 2% gap in TS% between opponents is a significant edge.
Net Rating
Offensive rating minus defensive rating. The single best summary metric for team quality. A net rating difference of 5+ points per 100 possessions between two teams is a strong signal for spread bets.
I use these metrics as the core inputs for my pre-game analysis, supplemented by pace factor for totals and rest data for schedule adjustments. The stats are freely available on NBA.com and Basketball Reference, updated within hours of each game. You don't need a paid subscription or a proprietary database to build a working model — you need three or four metrics that actually matter and the discipline to ignore the noise. For a deeper dive into which stats to use and how to source them, my guide on NBA betting models walks through the full process from regression basics to machine learning.
Integrity, Regulation, and What UK Bettors Should Know
In late 2025, NBA Commissioner Adam Silver sat down for a halftime interview and said something that cut through the usual corporate PR: "There's nothing more important to the league and its fans than the integrity of the competition, so I had a pit in my stomach. It was very upsetting." He was responding to a gambling scandal that had shaken the foundations of professional basketball, and his discomfort was palpable. If you're placing real money on NBA outcomes, you need to understand what happened and what it means for your bets.
In 2025, federal prosecutors unsealed indictments against 20 individuals for fixing NCAA basketball games — bribing 39 athletes across 17 or more Division I teams to manipulate the outcomes of at least 29 games. Bribe amounts ranged from $10,000 to $30,000 per player. The scheme was described by US Attorney Joseph Nocella Jr. as "an insider sports betting conspiracy that exploited confidential information about National Basketball Association athletes and teams." The investigation extended into the NBA itself, with arrests linked to insider information leaks.

The regulatory response was swift. Senator Ted Cruz, chairing the Senate Commerce Committee, warned that "fans shouldn't have to wonder if their favourite player missed a buzzer-beater or dropped a touchdown pass because of a secret bet." The hearings that followed pushed for federal oversight of sports betting integrity, and the NBA has accelerated its own monitoring systems. Silver himself argued that "the federal government has subpoena power, it can threaten to put people in jail, it can do all kinds of things that a league office can't do." The message: the league wants federal muscle backing its integrity efforts.
What this means for UK bettors: the integrity of NBA competition is a real concern, not a theoretical one. Manipulated games distort outcomes, which means your model's predictions can be invalidated by factors no statistical analysis can detect. The practical response is twofold. First, avoid exotic markets on lower-profile games where manipulation is easier to execute — star player props in marquee matchups are harder to fix than third-quarter totals in a midweek game between lottery teams. Second, bet through UKGC-licensed operators, which are subject to regulatory scrutiny and required to report suspicious betting patterns.
The UK's regulatory framework provides a layer of protection that American bettors in some states don't have. The UK Gambling Commission licenses 8,234 gambling premises and oversees 5,825 bookmaker outlets, and its remote licensing regime covers every online operator serving UK customers. That regulatory infrastructure matters because it creates accountability — operators must flag irregular betting activity, and punters have a formal complaints process if something goes wrong.
The shadow side of the UK market is worth acknowledging. Approximately £2.7 billion is wagered annually through unlicensed or unregulated platforms — about 2% of the licensed market. These operators sit outside UKGC oversight, which means no integrity monitoring, no deposit-limit tools, and no recourse if your funds disappear. Sticking with licensed platforms isn't just a legal recommendation; it's a risk-management decision. Every pound you place through an unlicensed operator is a pound placed outside the system designed to protect you.
The prediction market space adds another wrinkle. The American Gaming Association estimated that prediction markets diverted more than $500 million in potential tax revenue from regulated sports betting in early 2025 alone. These platforms operate in a regulatory grey zone — they're not traditional bookmakers, but they offer odds-like pricing on NBA outcomes. UK access to some of these platforms is limited, and the regulatory status is evolving. My advice: stick to what's regulated. The edge you gain from an unregulated platform's marginally better odds is not worth the counterparty risk.
The CourtEdge Pre-Bet Checklist
Every system I've built, every edge I've found, every lesson I've learned over 11 years comes down to a single discipline: running the checklist before placing the bet. Not after. Not during. Before. The checklist is the operational layer that sits between your analysis and your bookmaker account. It's the filter that catches the bets that look good but aren't, and it's the structure that ensures you're not skipping steps when you're tired, rushed, or riding a hot streak.
I developed this checklist iteratively — adding a step after every significant loss that could have been avoided. The version below is what I use today, and it takes me about 12-15 minutes per game. On a full NBA slate of 12 games, that's roughly three hours of pre-game work, which is why I typically narrow my slate to 4-5 games before running the full process.
CourtEdge Pre-Bet Checklist
- Check the schedule: is either team on a back-to-back, extended road trip, or rest mismatch?
- Review the injury report: are any starters or key rotation players listed as questionable, doubtful, or out?
- Confirm expected lineups: has the starting five been announced, and does it match your model's assumptions?
- Run the numbers: does your model or projection show a clear divergence from the posted line?
- Check line movement: has the spread or total moved significantly since opening, and do you understand why?
- Compare odds across at least three UK platforms: are you getting the best available price?
- Calculate expected value: does the bet clear your minimum EV threshold?
- Size the stake: apply your staking formula (flat unit or fractional Kelly) — never exceed your hard cap.
- Emotional check: are you betting because the data supports it, or because you want action?
- Record the bet: log the game, market, odds, stake, and reasoning before placing. If you can't articulate the reasoning in one sentence, don't bet.
Steps 1 through 3 take the longest because they require cross-referencing multiple sources. Steps 4 through 7 are mechanical once you have a model or projection in place. Steps 8 through 10 are the guardrails — the ones that prevent you from outsmarting your own system. I've skipped the emotional check exactly twice in 11 years, and both times I regretted it.
Do
- Run the full checklist for every bet, even when you're confident.
- Record your reasoning before placing — this builds your review database.
- Walk away if the emotional check flags a problem. The NBA plays 1,230 regular-season games. There will always be another opportunity.
- Adjust your model inputs as the season progresses — early-season data is noisy.
Don't
- Skip the injury report because the line "already accounts for it." Lines adjust, but not always fully or quickly.
- Chase a closing line you missed. If the price has moved past your value threshold, the bet no longer qualifies.
- Size up after a winning streak. Your bankroll grew, but your edge per bet didn't.
- Bet every game on the slate. The checklist exists to eliminate games, not justify them.
Frequently Asked Questions About NBA Betting Systems
What is an NBA betting system and how does it differ from a strategy?
A betting system is a specific, repeatable set of rules that dictates when to bet, what to bet on, and how much to stake. It produces testable outputs — you can backtest it against historical data and measure its performance over time. A strategy is the broader philosophy that guides your approach: for example, "I focus on schedule-based edges" is a strategy, while "I bet the under on away teams playing the second night of a back-to-back when the total hasn't moved more than 2 points from the opener" is a system. Every system lives within a strategy, but a strategy without a system is just a preference. The distinction matters because systems can be improved through data; preferences can't.
Do NBA betting systems actually work long-term?
Some do, most don't. The systems that work long-term share three characteristics: they're based on measurable, persistent market inefficiencies (like schedule fatigue); they incorporate proper bankroll management to survive inevitable losing streaks; and they evolve as the market adapts. A Light GBM machine-learning model demonstrated a simulated profit of $150,000 from a $100 starting investment over a single NBA season — but that was a lab simulation, not live betting. In the real world, you contend with line movement, bookmaker limits, and the fact that other sharp bettors are exploiting the same data. A realistic expectation for a well-run NBA system is single-digit percentage ROI over a full season, compounded over years. That's modest, but it's real.
Is it better to use a flat staking plan or a progressive system like Martingale?
Flat staking. The evidence is overwhelming. Progressive systems like Martingale require you to double your stake after every loss, which means a losing streak of 7-8 bets — a routine occurrence in NBA betting — demands stakes that exceed most bankrolls and hit bookmaker maximums. Simulation data shows that a 1/5 Kelly criterion approach (a form of proportional staking that adjusts to your estimated edge) returned over 98% ROI in a single-season simulation, while full Kelly — which is already more conservative than Martingale — led to complete bankroll depletion. Flat staking at 1-2% of bankroll per bet won't make you rich quickly, but it will keep you in the game long enough for your edge to compound.
What advanced stats should I use when betting on NBA games?
Start with three: field goal percentage, defensive rebound rate, and turnover rate. Research using XGBoost and SHAP analysis confirmed these are the most consistently significant predictors of NBA game outcomes across all four quarters. For second-half and live betting, add three-point shooting percentage and offensive rebounding rate, which gain predictive power as games tighten. Beyond individual metrics, Net Rating (offensive rating minus defensive rating) is the single best summary stat for overall team quality. Pace factor is essential for totals betting. All of these are available for free on NBA.com and Basketball Reference.
How can I identify value bets in NBA markets?
Value exists when your assessed probability of an outcome exceeds the implied probability in the bookmaker's odds. To find it, you need two things: a model that generates probability estimates, and access to odds from multiple bookmakers so you can compare prices. Calculate the implied probability of the offered odds (divide 1 by the decimal odds), then compare it to your model's output. If your model says 56% and the odds imply 51%, you have value. The practical requirement is a probability model — even a simple one based on Net Rating, pace, and schedule context will outperform betting by instinct. Line shopping across three or more UK platforms amplifies the effect.
How do back-to-back games affect NBA betting outcomes?
The second night of a back-to-back produces a measurable 1-3 point performance decline, with the effect most severe for road teams. Teams with losing records suffer more: below-.500 teams lose 11% more often than baseline on back-to-backs, compared to 5% for winning teams. When the second game is on the road, the loss rate jumps 18% above normal. García et al. documented a physical performance decline between the first and fourth quarters with an effect size of -1.27, and that fatigue compounds when teams are playing on consecutive nights. For bettors, back-to-backs are one of the most reliable schedule edges available — 19% of NBA games are decided in the fourth quarter, and fatigue disproportionately affects late-game execution.
What is the best bankroll management approach for NBA betting?
Fractional Kelly staking — specifically, 1/5 Kelly — offers the best balance of growth and risk protection based on simulation data. If you don't have a probability model precise enough to calculate Kelly stakes, flat staking at 1-2% of bankroll per bet is the safest default. The non-negotiable rules: never stake more than 3% of your bankroll on a single bet, set hard session limits, and use the deposit-limit and cooling-off tools available on UKGC-licensed platforms. Track every bet in a spreadsheet — date, game, market, odds, stake, result, and the reasoning behind the selection. Without tracking, you have no data to improve your system, and without improvement, your edge erodes as the market evolves.
Read also


Published by the CourtEdge team.
