
NBA Overtime Betting System: Live Wagering on Extra Periods
 Available in US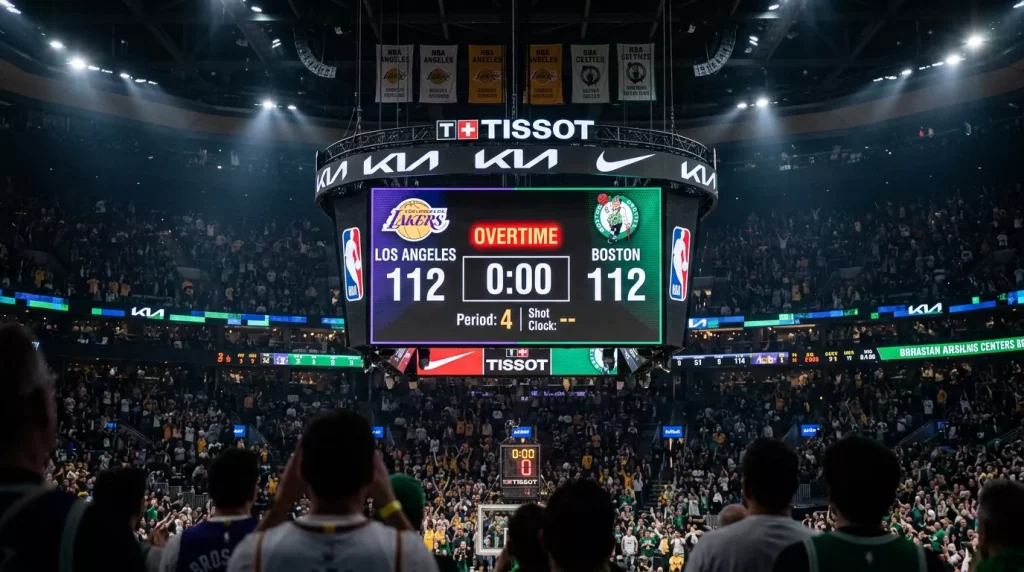
NBA Overtime Frequency: Historical Data for Live Betting
Overtime games are rare enough that most bettors never develop a system for them. That is precisely the reason I did. In thin markets where few people are paying attention, the edges tend to be wider — and NBA overtime is about as thin as it gets.
Across the last decade of NBA data, approximately 6-7% of regular-season games go to overtime. That translates to roughly 75-85 games per season out of 1,230 total. Double overtime happens in about 0.8% of games (roughly 10 per season), and triple overtime is vanishingly rare — one or two games a year at most. These are small sample sizes, which is why any OT system needs to be built on structural principles rather than back-tested trend-chasing.
The games that reach overtime share identifiable characteristics. They are disproportionately close throughout — games that are within five points at every quarter break are far more likely to be tied at the end of regulation than games where one team held a double-digit lead at any point. They also tend to feature strong defensive matchups, because elite defence suppresses scoring runs that would otherwise break the game open. Knowing these patterns does not help you predict which specific game will go to overtime, but it helps you identify games where the probability of OT is higher than the base rate — and that is where the betting angle lives.
Overtime Scoring Profiles: Pace, Fouls, and Star Minutes
Adam Silver has emphasised that the integrity of competition is essential to the league’s survival — and nowhere is that competitive intensity more concentrated than in overtime. Every possession matters. Every decision is magnified. And the scoring dynamics are fundamentally different from regulation play.
Overtime periods are five minutes long, which means the per-minute scoring intensity matters more than total points. Teams in OT typically score 10-14 combined points, but the variance is extreme. A single three-pointer or a pair of free throws can swing the margin in a five-minute window, and the strategic decisions — who takes the last shot, when to foul, whether to play for two or three — create outcomes that defy the statistical patterns of the preceding 48 minutes.
García et al. documented a performance decline with effect size of -1.27 between the first and fourth quarters. In overtime, that fatigue effect intensifies further. Star players who have already logged 38-42 minutes are now asked to perform at peak intensity for five more. Their shot quality declines, their defensive effort wanes, and the probability of mental errors — bad passes, lazy closeouts, poor foul management — increases. This fatigue dynamic is the single most exploitable feature of overtime for bettors, because the market’s live adjustments do not always fully account for the cumulative minutes burden on key players.
Foul trouble is the wildcard. A star player who picks up his fifth foul in the fourth quarter might sit for critical minutes before returning. If the game goes to OT and he has five fouls, his coach faces an impossible choice: play him aggressively and risk disqualification, or limit his minutes and accept a talent disadvantage. The live line in this scenario rarely reflects how dramatically one player’s foul situation can alter the overtime outcome.
A Live Betting System for Games Headed to Overtime
My OT betting system operates exclusively in the live market, because the opportunity only materialises when a game reaches the final minutes of regulation tied or within one possession.
The trigger fires when a game is tied or within two points with under 90 seconds remaining in the fourth quarter. At that point, I assess three factors. First, which team has fresher legs? If one team’s starters have logged four or more minutes less than the opponent’s starters, fatigue asymmetry favours the fresher team in OT. Second, which team has foul trouble? A star player with five fouls is a liability in overtime, and the opponent gains a tangible advantage. Third, which team has the better free throw shooters? Overtime games are decided at the line more often than any other period, because intentional fouling is the default strategy for the trailing team.
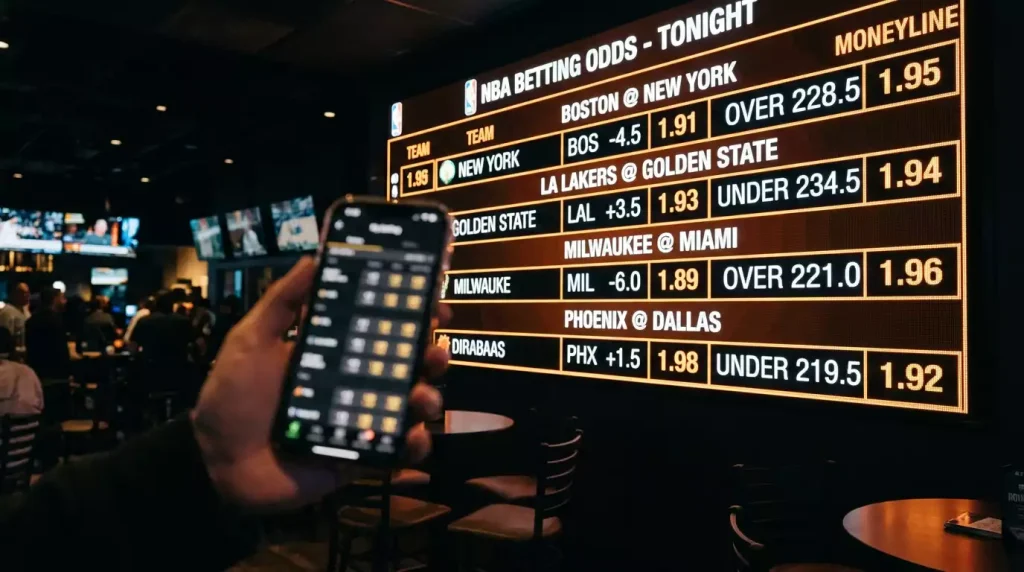
When the fresher team also has the better free throw shooting, I bet their live moneyline if the odds offer value — usually when the game is tied and both sides are priced near 2.00. The edge is small per bet but consistent, because the structural advantages of rest and free-throw accuracy are real and the live market at the end of regulation does not always price them accurately.
I also look at the live total for the overtime period specifically, where available. UK bookmakers increasingly offer OT-specific markets, and the typical posted total for a five-minute period is 10.5 or 11.5 combined points. In games where both teams’ star players are visibly exhausted — heavy legs, laboured movements, missed shots they would normally make — the under on the OT total becomes attractive. The fatigue effect that has been accumulating all game reaches its peak in overtime, and scoring efficiency drops accordingly.
There is one more OT pattern worth tracking: home team performance. The home team wins roughly 55-58% of overtime periods in the regular season, which is slightly lower than the overall home win rate of approximately 60%. The reason is that overtime is such a small, high-variance sample that the home-court energy advantage gets diluted by execution randomness — a single missed free throw or turnover swings the outcome. I do not bet home teams in overtime purely on the venue edge, but I do give them a marginal lean when other factors (fatigue, foul trouble, free-throw shooting) are balanced.
The volume of this system is low by design. Roughly 75 games per season go to overtime, and I only bet the ones where the structural triggers align clearly. That produces maybe 20-25 OT bets per season — a niche within a niche. But the win rate on those bets has justified the effort across four seasons of tracking, precisely because so few bettors are doing this work. For a broader framework on how live betting strategies work across all four quarters and overtime, my guide on NBA live betting strategy covers the full system.
Articles

Prepared by the CourtEdge editorial staff.
