Pace Factor Explained: The Single Best Predictor of NBA Totals
Loading...
How to Calculate and Compare Pace Factor
Three years ago, I ran an experiment. I stripped every variable out of my totals model except one — pace factor — and bet a full NBA season using nothing else. The result was a 4.2% ROI on 187 bets, which was better than my multi-variable model had managed the previous year. That single number, pace factor, carried more predictive weight than everything else I had been tracking combined.
Pace factor measures the number of possessions a team uses per 48 minutes. The formula is straightforward: take a team’s total possessions across all games and divide by minutes played, then multiply by 48 to normalise to a full game. NBA.com and Basketball Reference both publish this number, updated daily, so you never have to calculate it manually unless you want to.
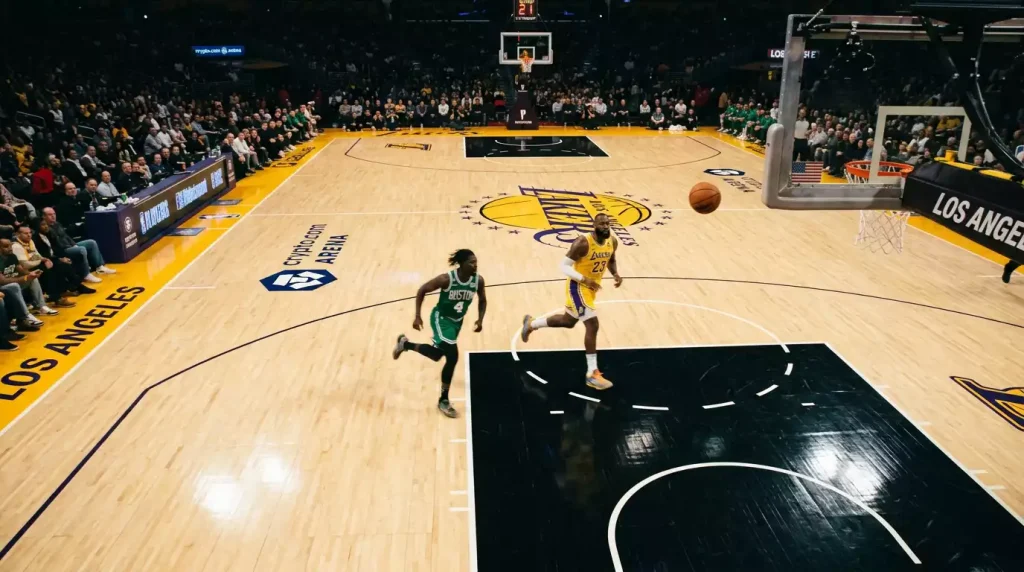
The number itself typically ranges from about 96 to 104 in the modern NBA. That might look like a narrow band, but the gap between a pace of 97 and a pace of 103 translates to roughly six extra possessions per game. At an average efficiency of about 1.12 points per possession, six possessions add nearly seven points to the expected total. When two high-pace teams meet, that effect doubles. When two slow teams collide, you get those grinding 198-point games that make over bettors question their life choices.
To compare pace factors for a specific matchup, I average the two teams’ pace ratings and compare that average to the league median. If the matchup pace sits more than two possessions above the league median, I flag the game as a potential over candidate. If it sits more than two below, it goes on the under list. Simple, but effective — and it takes about 30 seconds per game once you have the numbers in front of you.
One important nuance: pace factor is not static across a season. Teams speed up or slow down based on personnel changes, coaching adjustments, and schedule density. Always use rolling pace data — the last 10-15 games — rather than full-season averages, especially after the trade deadline when rosters shift dramatically. A team that played at 98.5 pace before acquiring a fast-break point guard might jump to 101.0 within two weeks, and the full-season average will mask that change for another month.
Pace-to-Total Correlation: What the Data Shows
I keep hearing people say pace is “one factor among many” for totals betting, as if it sits alongside referee tendencies and arena altitude in some democratic ranking of influences. It does not. Pace is the dominant factor, and the data is unambiguous about this.
When you plot combined matchup pace against final game totals across a full NBA season, the correlation coefficient sits consistently between 0.55 and 0.65. For context, that is a stronger single-variable correlation than you will find in almost any other sports betting market. Nothing else I have tested — defensive rating, three-point attempt rate, free throw rate, rest days — comes close to that predictive power on its own.
The reason is mechanical. More possessions mean more shot attempts, more free throw trips, more transition opportunities, and more points. Defensive quality can suppress efficiency on any given possession, but it cannot erase possessions themselves. A team that forces turnovers at a high rate might limit the opponent’s efficiency, but those turnovers often lead to fast-break points that inflate the total anyway. Pace captures the volume of scoring opportunities; efficiency determines how many convert. Volume is the more stable of the two.
The median pace in fourth quarters of close games drops to 90-100 possessions — well below the first-half tempo. That late-game slowdown is why games that look headed for a comfortable over at halftime sometimes stall in the final 12 minutes. Close games produce intentional fouls, clock management, and deliberate half-court sets that eat time and reduce possessions. If you are betting first-half totals separately from full-game totals, the pace-to-total correlation is actually stronger for the first half because the slowdown effect has not kicked in yet.
Garcia et al. measured a physical performance decline with an effect size of -1.27 between the first and fourth quarters. That fatigue factor compounds the pace drop in close games: tired players move more slowly through their sets, take longer to get into position defensively, and execute transitions less crisply. The combination of deliberate strategy and physical fatigue makes the fourth quarter a fundamentally different pace environment from the first three quarters.
What this means for bettors: a pace-based total projection works best when you weight early-game pace more heavily than late-game pace. The first three quarters follow pace trends predictably; the fourth quarter introduces strategic noise that pace alone cannot capture.
Using Pace Data to Beat UK Bookmaker Totals
Every morning before the NBA slate, I pull up the schedule and check three numbers for each game: Team A’s rolling 10-game pace, Team B’s rolling 10-game pace, and the average of the two. That takes about five minutes for a full night of games. Then I compare each matchup’s average pace to the bookmaker’s posted total.
Here is the key insight that took me years to internalise: bookmakers already use pace in their models. You are not going to find five-point discrepancies between a pace-based projection and the posted total on a random Tuesday night. The edges are small — one to three points — and they appear most often in specific situations.
Situation one: a team’s pace has shifted recently but the market has not caught up. This happens after trades, coaching changes, or the return of a key player from injury. If a team’s 10-game rolling pace is 102.3 but their season average is 99.1, bookmakers using the season number will undershoot the projected possessions. These windows last about a week before the market adjusts.
Situation two: back-to-back games where one team’s pace profile changes under fatigue. Tired teams play slower. A team that normally runs at 101.5 pace might drop to 98 or 99 on the second night of a back-to-back, particularly on the road. If the bookmaker has not fully discounted that fatigue-driven pace drop, the posted total will be too high.
Situation three: late-season games between teams with nothing to play for. When starters sit and bench players log heavy minutes, pace becomes unpredictable. Some bench units play faster because they are less disciplined; others play slower because they lack the talent to create in transition. The bookmaker’s total for these games is essentially a guess, and your own pace research on the expected rotation gives you an information edge.
For UK bettors specifically, the timing works in your favour for one reason: opening lines for NBA games typically appear on UK platforms around midday, and the games do not tip off until late evening. That window gives you six to ten hours to compare the opening total against your pace projection, monitor injury news that might affect the number, and place your bet before the closing line moves. American bettors in the Eastern time zone have a much shorter window between lines opening and tip-off. The time zone disadvantage for watching games becomes a research advantage for pre-game analysis.
I have one rule that has saved me more money than any model: never bet a total where your edge is less than 1.5 points. If your pace projection says 218 and the line is 219.5, that is a pass. The margin is too thin to absorb the variance inherent in basketball scoring. You need a clear gap — two points or more — to justify the bet. Discipline on entry is where the profit lives, not in the volume of bets you place.
If you want to see how pace fits into a broader NBA over/under strategy that accounts for defensive matchups and seasonal trends, I have laid that out separately. Pace is the foundation; everything else is refinement.
Articles


Prepared by the CourtEdge editorial staff.